If you’re learning C on Linux, typing out gcc program.c -o program && ./program for every tiny change gets tedious fast — and the bare compiler command hides bugs that would otherwise show up as warnings. Here’s a practical workflow: faster ways to compile and run, the flags you should always turn on, tools that get you closer to a REPL, how to debug crashes and memory errors, and a routine for practicing deliberately.
1. The Fastest Way to Practice: One-Liners and Aliases
Typing gcc program.c -o program && ./program every time gets old fast. Here are three ways to speed it up.
Option A: The One-Liner with &&
The && means “only run the next command if the previous one succeeded.” This prevents you from running a stale old binary if your code has compile errors.
gcc program.c -o program && ./programOption B: Bash Aliases (Highly Recommended)
Open your shell config file:
nano ~/.bashrcAdd these lines at the bottom:
# Compile and run C
alias crun='gcc -Wall -Wextra -g -o /tmp/a.out && /tmp/a.out'
alias cwarn='gcc -Wall -Wextra -Wpedantic -g -o /tmp/a.out'
Save, then reload:
source ~/.bashrcNow, from any directory, you can just type:
crun program.cThis compiles program.c with all warnings enabled, outputs to /tmp/a.out, and runs it immediately if compilation succeeds. cwarn is useful when you want to compile but not run yet.
Option C: A Simple Makefile
For anything beyond a single file, create a file named Makefile in your working directory:
CC = gcc
CFLAGS = -Wall -Wextra -g -std=c11
TARGET = program
SRC = program.c

all: $(TARGET)

$(TARGET): $(SRC)
    $(CC) $(CFLAGS) -o $(TARGET) $(SRC)

run: $(TARGET)
    ./$(TARGET)

clean:
    rm -f $(TARGET)
Then you just type:
make runAnd to clean up:
make cleanThis is the professional standard and scales to multiple files later.
2. The Flags You Should Always Use
The bare-minimum command gcc program_name.c -o my_program works, but it hides problems. Always add these flags:
gcc -Wall -Wextra -Wpedantic -g -std=c11 program.c -o program| Flag | What it does |
|---|---|
-Wall |
Enables most common warnings (uninitialized variables, unused variables, etc.) |
-Wextra |
Enables additional warnings beyond -Wall |
-Wpedantic |
Warns about non-standard C extensions |
-g |
Includes debug symbols (essential for gdb) |
-std=c11 |
Uses the C11 standard (or use -std=c17, -std=c99) |
-O2 |
Optimization level 2 (for release builds; don’t use while debugging) |
Why warnings matter: In C, many bugs are not errors—they compile fine but crash at runtime or behave incorrectly. Warnings catch these before you run. Treat every warning as an error you must fix.
To make warnings fatal (force yourself to fix them):
gcc -Wall -Wextra -Werror -g program.c -o programWith -Werror, the compiler refuses to produce an executable if there are any warnings.
3. Faster Testing: The REPL-like Workflow
C doesn’t have a REPL like Python or R, but you can approximate one with these tools:
Tool 1: tcc (Tiny C Compiler)
tcc compiles and runs C almost instantly. Install it:
sudo apt install tcc    # Debian/Ubuntu
sudo dnf install tcc    # Fedora
Then:
tcc -run program.cThis compiles and runs in one step with no output file. It’s the closest thing to a C REPL for quick experiments. It’s not as strict as gcc, but great for testing small snippets.
Tool 2: cling (C++ Interpreter, works for C)
cling is an interactive C++ interpreter built on LLVM. It can run C code interactively:
sudo apt install cling   # May need to add a PPA or download from GitHub
cling
Then type C statements directly:
printf("Hello\n");
int x = 5;
x * 2
This is genuinely REPL-like and excellent for experimenting with expressions.
Tool 3: Online Compilers (for zero-setup experiments)
- Compiler Explorer (godbolt.org): Shows the assembly output side-by-side with your C code. Incredible for understanding what the compiler does.
- OnlineGDB (onlinegdb.com): Full IDE with debugger in the browser.
- Replit (replit.com): Collaborative, instant C environment.
Use these when you want to test a quick idea without touching your terminal.
4. Debugging: gdb and valgrind
gdb (GNU Debugger)
Compile with -g, then:
gdb ./programInside gdb:
(gdb) break main        # Set a breakpoint at main
(gdb) run               # Start the program
(gdb) next              # Execute next line
(gdb) print x           # Print value of variable x
(gdb) continue          # Continue execution
(gdb) quit              # Exit
This lets you step through your code line by line, inspect variables, and see exactly where a crash happens. Essential for finding segmentation faults.
valgrind (Memory Error Detector)
This is critical once you start using malloc and free:
valgrind --leak-check=full ./programIt will tell you: * If you leaked memory (allocated but never freed) * If you accessed memory you shouldn’t have * If you used uninitialized memory
Install it:
sudo apt install valgrindRun this on every program you write that uses dynamic memory. It will save you hours of confusion.
5. A Suggested Practice Routine
Week 1–2: Fundamentals Write 5–10 small programs per day covering: * Variables, types, printf/scanf * if/else, switch * for, while, do-while * Functions and recursion
Week 3–4: Arrays and Strings * Reverse an array * Find the max/min * Implement strlen, strcpy, strcmp yourself * Bubble sort, selection sort, insertion sort on arrays
Week 5–6: Pointers * Swap two variables using pointers * Pass arrays to functions * Pointer arithmetic * Dynamic arrays with malloc/free
Week 7–8: Structs and Files * Define a struct for a student record * Read/write structs to a binary file * Build a simple linked list
Daily habit: 1. Write the program in a text editor (use nano, vim, or VS Code). 2. Compile with all warnings: gcc -Wall -Wextra -Wpedantic -g -std=c11 file.c -o file 3. Fix every warning. 4. Run it. 5. If it crashes, use gdb. 6. If it uses malloc, run valgrind.
6. Recommended Editors/IDEs on Linux
- VS Code with the C/C++ extension: Best balance of features and simplicity. Has integrated debugging.
- Neovim/Vim with
coc.nvimorclangd: For terminal purists. - CLion: Full-featured IDE (free for students with a JetBrains account).
- Code::Blocks: Lightweight IDE, good for beginners.
Quick Reference Card
# Compile with all warnings
gcc -Wall -Wextra -Wpedantic -g -std=c11 program.c -o program

# Compile and run (only if compile succeeds)
gcc -Wall -Wextra -g program.c -o program && ./program

# Run with memory checking (for programs using malloc)
valgrind --leak-check=full ./program

# Debug
gdb ./program

# Quick test with tcc
tcc -run program.c

# Using make
make run
make clean
Pin an alias, turn on -Wall -Wextra, and reach for gdb/valgrind the moment something misbehaves — that’s most of the workflow. The rest comes from writing a lot of small programs, which is exactly what the practice routine above is for.
7. My Personal Choice
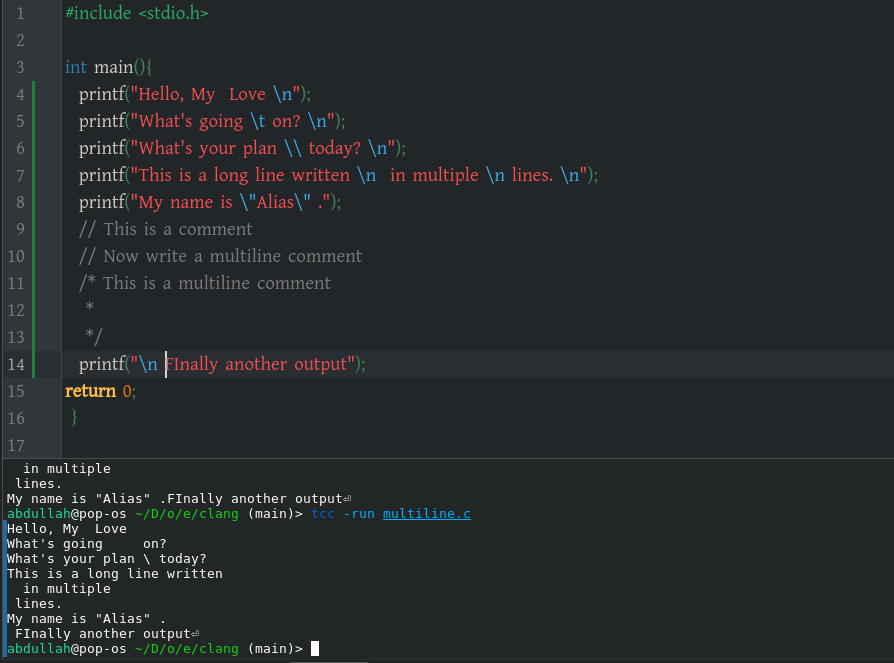
I installed tcc, and now I write code in the Kate editor and run it in the terminal at the bottom.
tcc -run program.c