Why Use the Geometric Distribution?
2 min
probability
discrete distributions
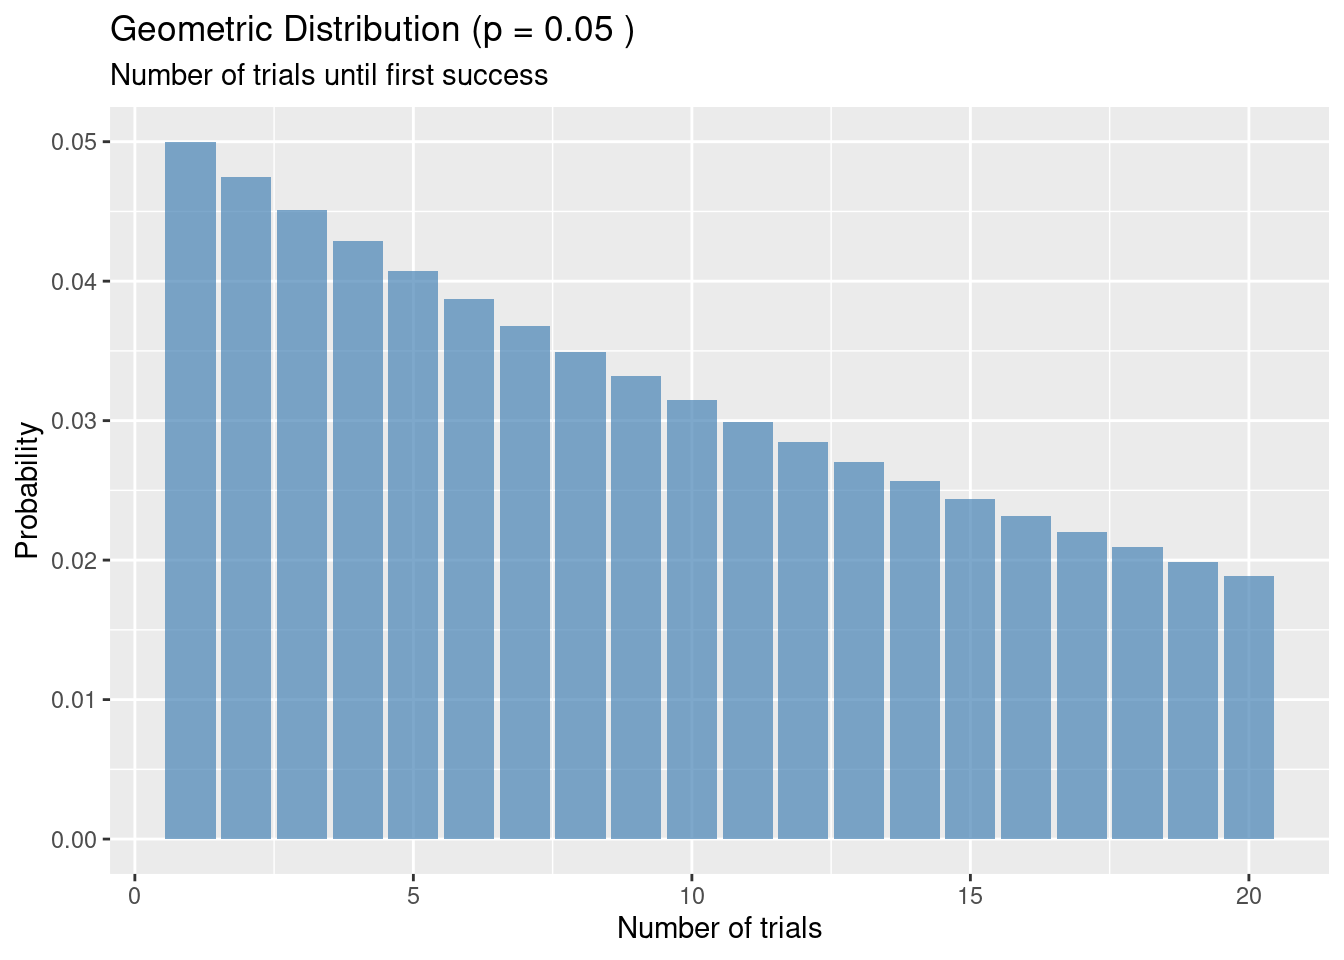
geometric distribution
The geometric distribution models the number of trials until the first success in independent Bernoulli trials. This post explains when and why to use it, with a real-world…
Jun 3, 2026