library(tidyverse)

data <- data.frame(
  category = letters[1:15],
  value    = c(50, 40, 30, 20, 15, 8, 7, 6, 5, 4, 3, 2, 2, 1, 1)
)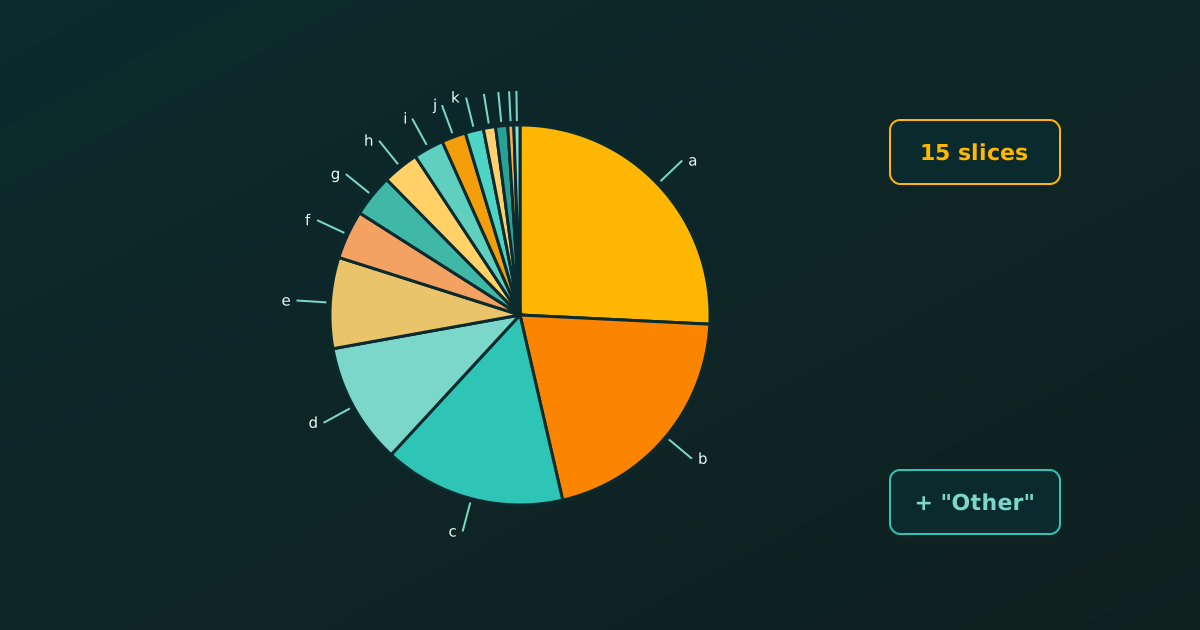
With many categories a pie chart becomes unreadable: the slices are narrow, the labels overlap and the colours are hard to tell apart. Experts usually advise either lumping the small categories into an “Other” group or switching to a bar chart. Let’s see how to do both, and how to keep every category visible when we must, using ggplot2.
Note
All the plots here keep the default ggplot2 grey panel. For a pie we only hide the axis text, ticks and titles, which carry no meaning in polar coordinates. The same recipe works for the pie charts in Pie Chart vs Bar Chart.
The Data: Fifteen Categories
Here are fifteen categories with very uneven values. We reuse this data throughout.
A small helper theme hides the useless polar axes while keeping the default grey background.
pie_theme <- theme(
  axis.title  = element_blank(),
  axis.text   = element_blank(),
  axis.ticks  = element_blank(),
  panel.grid  = element_blank()
)
The Problem: All Fifteen Slices
ggplot(data, aes(x = "", y = value, fill = category)) +
  geom_col(width = 1, colour = "white") +
  coord_polar(theta = "y") +
  pie_theme +
  labs(title = "Fifteen slices", fill = NULL)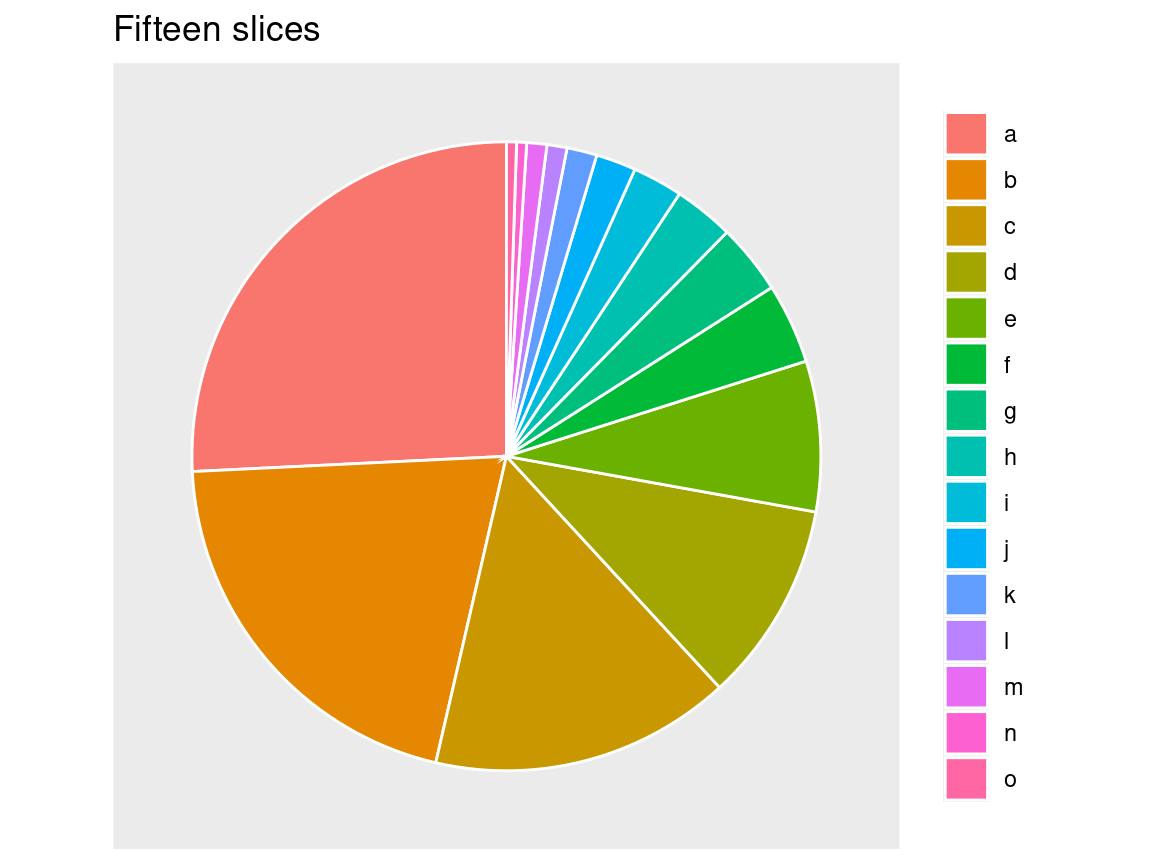
The last six slices are slivers, and fifteen colours are too many to match against the legend.
Lump Small Categories into “Other”
The best fix is to keep the largest categories and merge the rest. fct_lump_n() from forcats (part of the tidyverse) keeps the top n and groups everything else as “Other”. The argument w tells it to rank by value, not by row count.
clean_data <- data %>%
  mutate(category = fct_lump_n(category, n = 5, w = value)) %>%
  group_by(category) %>%
  summarise(value = sum(value)) %>%
  mutate(percentage = value / sum(value) * 100)

ggplot(clean_data, aes(x = "", y = value, fill = category)) +
  geom_col(width = 1, colour = "white") +
  coord_polar(theta = "y") +
  geom_text(aes(label = paste0(round(percentage), "%")),
            position = position_stack(vjust = 0.5), colour = "white") +
  scale_fill_brewer(palette = "Dark2") +
  pie_theme +
  labs(title = "Top five categories plus Other", fill = NULL)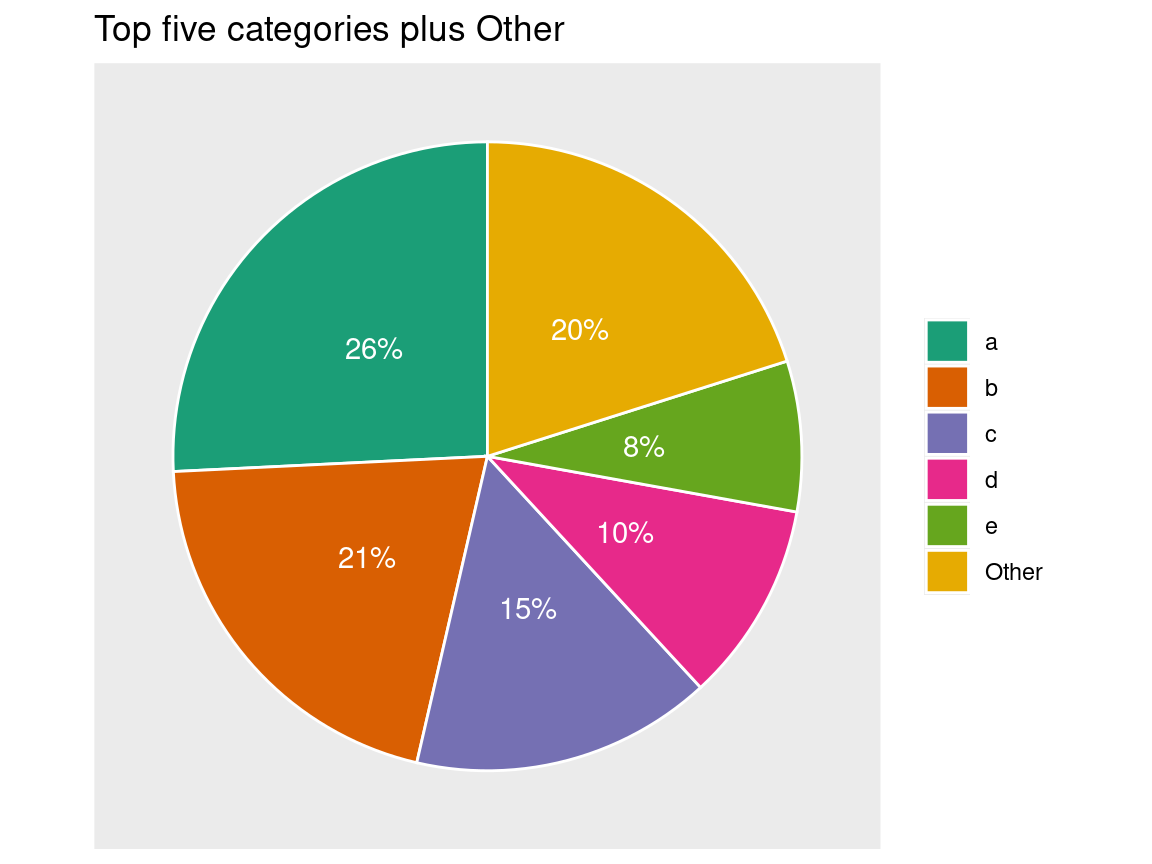
Now six slices remain and each can carry a percentage label. The price is that the detail of the small categories is hidden inside “Other”.
Showing Every Category: Labels with Leader Lines
If every category must appear, put the labels outside the circle and join them to their slices with lines. The ggrepel package (install.packages("ggrepel")) pushes labels apart automatically, so they do not overlap.
First we compute the middle of each slice. Because geom_col() stacks the first level on top, we reverse the order before taking the cumulative sum.
library(ggrepel)

labelled <- data %>%
  mutate(category = factor(category, levels = rev(category)),
         prop = value / sum(value) * 100,
         ypos = cumsum(prop) - 0.5 * prop)

ggplot(labelled, aes(x = "", y = prop, fill = category)) +
  geom_col(width = 1, colour = "white") +
  coord_polar(theta = "y") +
  geom_label_repel(aes(y = ypos, label = paste0(category, ": ", round(prop, 1), "%")),
                   nudge_x = 0.8,
                   segment.colour = "grey30",
                   size = 3.5,
                   show.legend = FALSE) +
  pie_theme +
  theme(legend.position = "none") +
  labs(title = "All fifteen categories, labelled outside")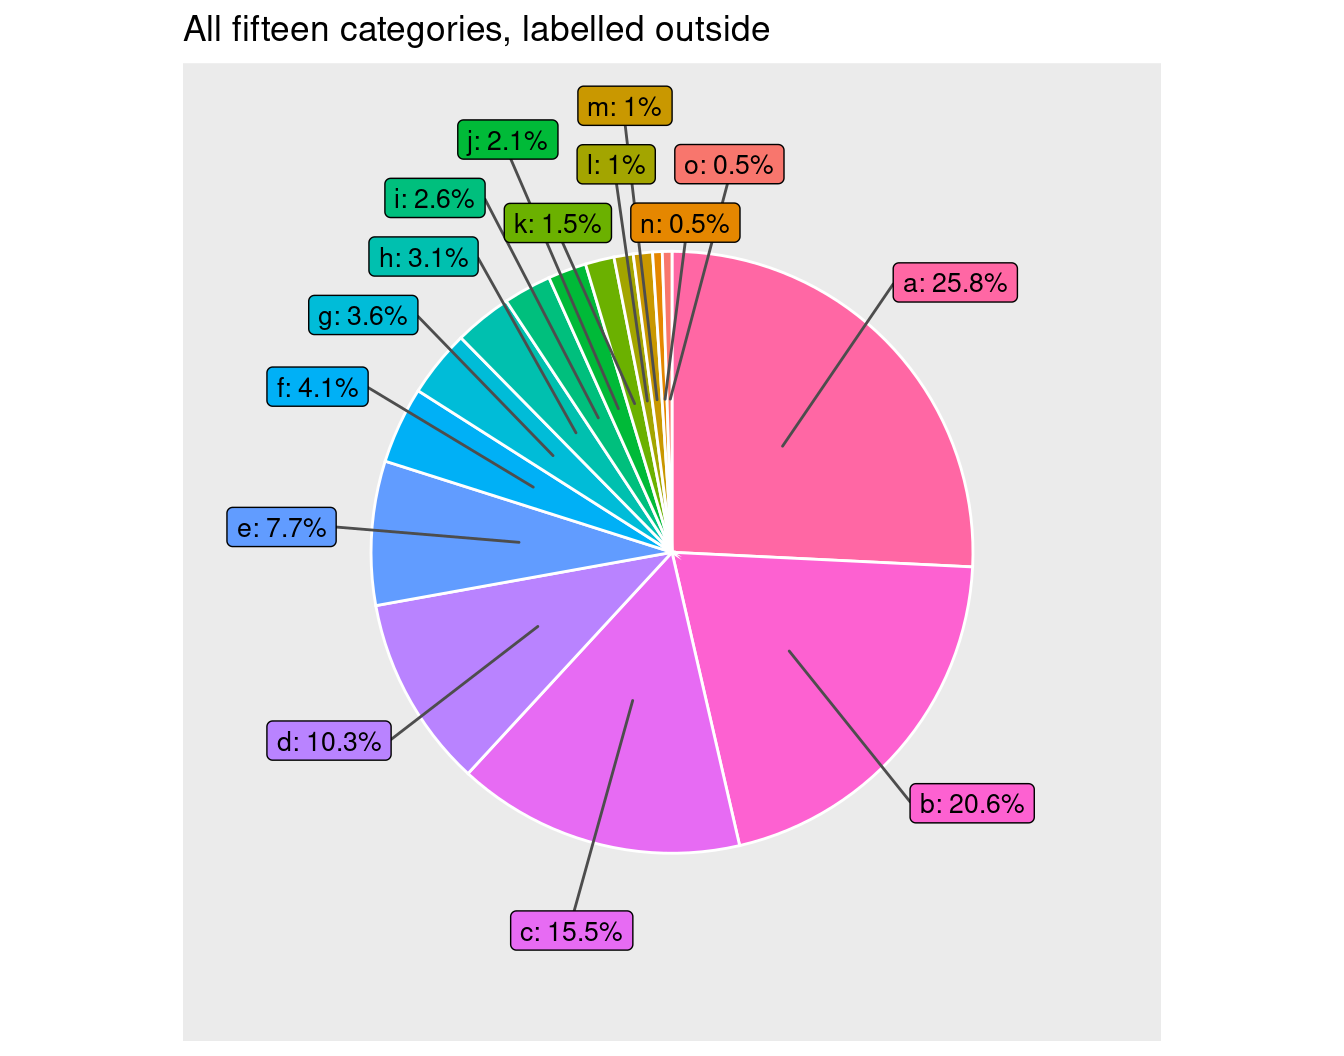
nudge_x moves the labels outward, and the segments are drawn automatically. This stays readable up to roughly ten to fifteen categories.
A Bar Chart Handles Dozens of Categories
When there are many categories, a sorted horizontal bar chart is the standard replacement. It needs no legend and leaves room for long labels.
ggplot(data, aes(x = value, y = reorder(category, value))) +
  geom_col(fill = "steelblue") +
  labs(title = "The same fifteen categories", x = "Value", y = NULL)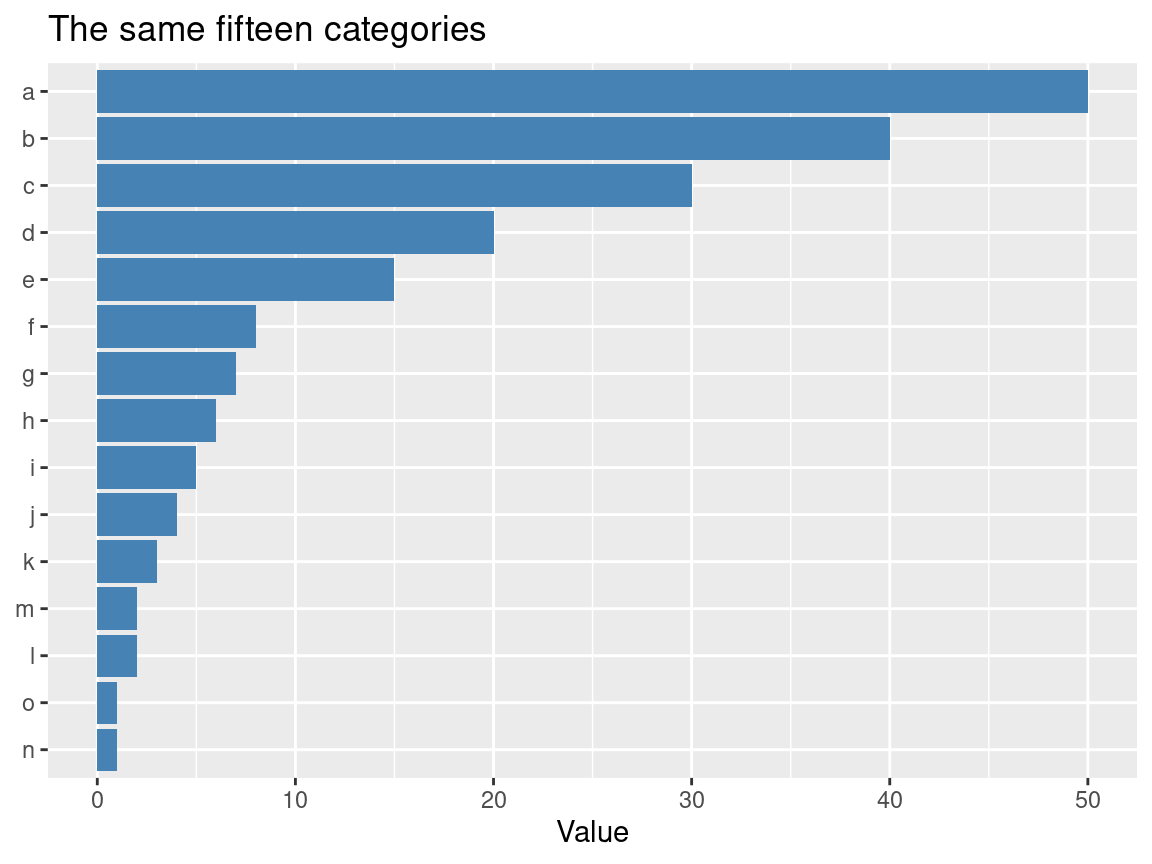
An Interactive Option
For dashboards and web pages, an interactive pie lets readers hover to see values and click the legend to hide categories. The plotly package does this (install.packages("plotly")).
library(plotly)

plot_ly(data, labels = ~category, values = ~value, type = "pie")
Which Should We Choose?
| Strategy | When to use | Pros | Cons |
|---|---|---|---|
fct_lump_n() + pie |
Reports, papers, slides | Clean and instantly readable | Hides the small categories |
ggrepel labels |
All categories must show, up to about 15 | Keeps every category | Still busy |
Interactive plotly |
Dashboards, websites | Keeps all information | Not for print |
| Bar chart | General best practice | Handles dozens of categories | Loses the part-to-whole look |
In short, lump first, label outside if every category is needed, and prefer a bar chart when the categories are many.